 |
Last Update:
Thursday November 22, 2018
|
| [Home] |
|
Volume 18 Issue 1 Pages 1 - 53 (April 2001) Citation: Reuther, C. & Roy, A. (2001) Some results of the 1991 and 1999 otter (Lutra lutra) surveys in the River Ise catchment, Lower-Saxony, Germany. IUCN Otter Spec. Group Bull. 18(1): 28 - 40 Some results of the 1991 and 1999 otter (Lutra lutra) surveys in the River Ise catchment, Lower-Saxony, Germany 1
Aktion Fischotterschutz e. V., OTTER-ZENTRUM, 29386 Hankensbüttel,
Germany (received 22nd May 2001, accepted 10th June 2001)
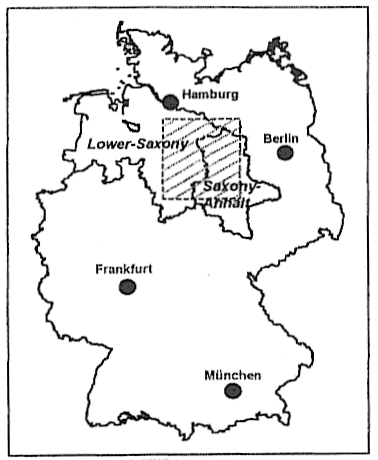
INTRODUCTION The 450 km long river system of the Ise River with a catchment of 420 square kilometres represents the (habitat) bridge between the most eastern otter occurrence of the federal state of Saxony-Anhalt and the most eastern otter occurrence of the federal state of Lower-Saxony (Fig. 1). Within the last 100 years, this river system was canalised without any consideration of ecological aspects and the adjacent landscape was transferred to an extreme intensive agriculture utilisation. This resulted in a loss of structure and species diversity, the reduction of water and substances retention, a high pollution with fertilizers and pesticides, a reduction of dynamic processes - and the extinction of the otter between 1960 and 1970.
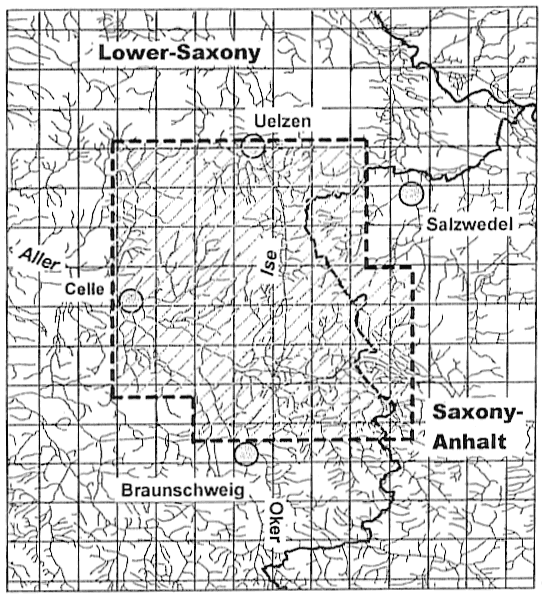
Since 1987 the German Association for Otter Conservation ('Aktion Fischotterschutz') is working on the revitalisation of this river system. There were four fundamental premises for the realisation: no reconstruction of a 'historical state' of the river system, no technical recreation of the river bed, no establishment of a protected area, and a realisation on a voluntary base for all persons and interest groups concerned (REUTHER et al., 1993). The project should show if it is possible to initiate a (semi-)natural development of a canalised river system by utilising its own natural dynamics and by altering the agricultural practice in the river's lowland from intensive to extensive use. One of its main objectives was the re-connection of the above mentioned otter populations. So far approximately 1,000 hectares of arable land were transformed into extensive pastureland, more than 20 kilometres of riparian woods and hedges were planted and more than 50 kilometres of marginal zones along rivers and roads form a "green net" in this area. Beside these more traditional conservation tools, great efforts have been invested in public relations and education activities (BORGGRÄFE and KÖLSCH, 1997; REUTHER, 2001). As part of the scientific evaluation of the project, carried out parallel to the management activities also since 1987, two surveys have been carried out to investigate the distribution of otters. They covered an unequal study area and number of survey sites (both were higher in the second survey). To enable a comparison, all data and results presented here are related to the identical part of the study area and number of survey sites for both surveys. STUDY AREA The study area (Fig. 2) is located in the northern German lowland in the border area between the two German federal states of Lower-Saxony and Saxony-Anhalt. It covers the complete catchment of the Ise River and parts of the surrounding river and wetland systems Aschau and Lachte (western border), Aue and Dumme (northern border), Ohre and Drömling (eastern border) and Oker (southern border). The running waters contain completely canalised watercourses as well as streams and rivers with low human impact. Most of the watercourses are typical slow running lowland rivers passing a mixture of forests, meadows and arable farm land. At the western border of the study area several large fish pond areas are formed by dammed watercourses or by groundwater ponds. The south-eastern part of the study area is dominated by a large spacious wetland area formed by wet meadows and numerous ditches and small canals. The whole study area has a size of 2,736km2. Its borders were adjusted to the German mapping system based on the topographic map 1:25,000. Each of these maps covers an area of approximately 124.4km2. The study area contains 22 of the map sheets.
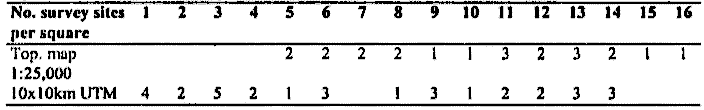
MATERIAL AND METHODS The first survey was carried out by Udo Binner from 1 October until 10 December 1991 (BINNER, 1991). He investigated 247 survey sites. The second survey was carried out by Anja Roy from 30 August until 5 October 1999 (ROY, 1999). She investigated 272 survey sites. 226 survey sites were identical in both surveys. They form the basis for this report. Both surveyors were well experienced in identifying signs of otters. The average number of survey sites investigated per day was 10 in the second survey. For the first survey these data are not available. The method used followed the standards for otter surveys recommended by the IUCN/SSC Otter Specialist Group (REUTHER et al., 2000) with the exception of the number and spreading of survey sites. All survey sites and their coordinates were identified on a topographic map 1:25,000 by trying to cover all waters in the study area. This resulted in an uneven spreading and number of survey sites as well in the grid of the (national) 1:25,000 topographic map as in the (international) 10x10km UTM grid (Table 1). The average number of survey sites was 10,3 per square of the national grid (11.15x11.15km) and 7.1 per square of the international grid (10x10km).
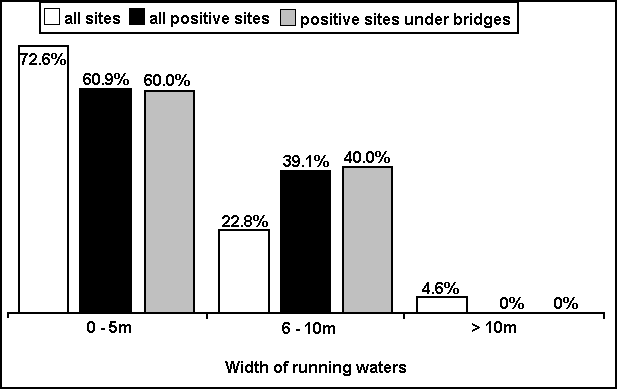
Each survey site was investigated for a maximum distance of 600m for signs of otters exclusively. Only spraints and footprints were accepted as a proof. As soon as a sign of otters was found, the investigation of the site was stopped. Because the search direction was not documented in the first survey the direction was chosen in the second survey on the basis of highest portion of cover and potential number of sprainting sites visible at the starting point. In the second survey for each survey site the weather conditions, water level, kind and density of vegetation, width of running waters, kind and number of proofs, and the spreading of proofs in 50m intervals for the search distance of 600m were documented. In both surveys all spraints were collected and all footprints were photographed and the proofs were stored by Aktion Fischotterschutz. RESULTS The number of positive sites and the kind of proofs for the two surveys are presented in Table 2. Within eight years the percentage of positive sites increased by nearly five times. Whilst having found in 1991 only each eighth 10x10km UTM square positive in 1999 this was the case for nearly each second 10x10km UTM square. It is also obvious that the relation of the kind of proofs changed remarkable. The following results refer to the second survey (1999) exclusively because the number of positive sites of the first survey was too low and the documentation of additional data was not sufficient. 224 of the 226 survey sites were located at running waters. The width of the streams and rivers was grouped in three classes. All positive sites were found at running waters. 89.7% of the 226 survey sites were connected with bridges. Of the 23 signs of otters, 15 (= 65.2%) were found under bridges and 8 (= 34.8%) away from bridges. The percentage of total survey sites, of positive survey sites, and of positive survey sites under bridges related to these three classes for the width of running waters is presented in Figure 3. As the results show, nearly three fourth of the survey sites were located at running waters of a width of 5m and less. However, there seems to be a tendency for a higher portion of positive sites located at running waters of a width of 6-10m.
Relating the kind of proofs to the width of running waters and to the place of finding is not very predicative because of the low number of positive sites. However, there is an obvious tendency for spraints as the major kind of proof at waters of a width up to 5m (Table 3).
Because of the high percentage of survey sites which were connected with bridges and the high number of findings under bridges it is not surprising that the majority of the positive sites shows short distances which needed to be searched to find the first sign of an otter (Table 4).
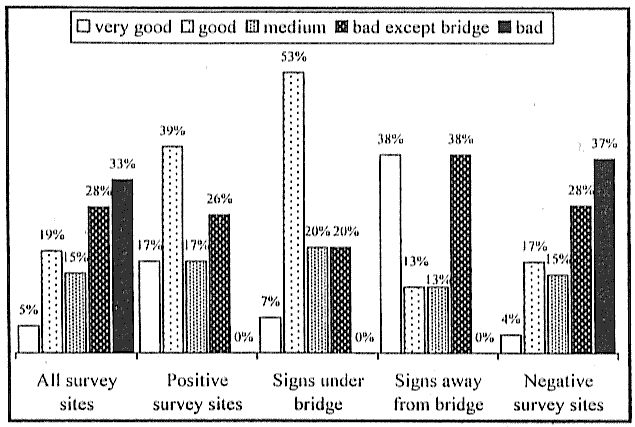
To get an idea of a possible correlation between the structures of the search stretches and the finding of signs of otters a (subjective) 'potential sign probability1 was rated by the surveyor for 192 survey sites. This probability was ranked in five classes:
As is shown in Figure 4 no signs of otters were found at search stretches which were rated 'bad' and more than half of the signs were found at search stretches which were rated "very good" or "good".
DISCUSSION It needs to be underlined that the overall percentage of positive sites of this study is not comparable to the results of surveys carried out by the 'Standard Survey Method' (REUTHER et al, 2000), because the number and spreading of survey sites per square of the UTM grid is too uneven. This is a regional survey carried out to observe a possible recovery tendency of the otter on a local base. Unfortunately it was not possible to carry out the surveys at the same time of the year because of organisational reasons. It is a fact that various surveys in different European regions show certain seasonality in finding signs of otters which can vary between regions, water systems and years (REUTHER et al., 2000). However, this seems to be more a problem if sign counts are used for estimation of population density. For surveys aiming mainly at distribution, this aspect can be largely ignored. As was shown by REUTHER et al. (2000), most decreases (or lowered levels) in sign numbers last for 1 - 2 months only before the number of signs increases again. Further, as has been shown by several studies, otter spraints can remain in the environment for a long time - depending on their position and the climatic conditions (JENKINS and BURROWS, 1980; KRUUK et al., 1986; MASON and MACDONALD, 1986; MACDONALD and MASON, 1988). In general at least 10% of spraints remain collectable for more than 8 weeks and, at protected places (such as under bridges), they can remain for up to one year. Therefore in the interpretation of the results the fact is ignored, that the second survey was started one months earlier and was finished two months earlier than the first survey. The majority of the survey sites was investigated in October in the first survey and in September in the second survey. There was no flooding or high water level before or during both surveys, which could have eliminated spraints. The fact that 89.7% of the survey sites were connected with bridges also increases the probability that spraints remained long enough to be found, although a decrease of spraining activity of otters in this area might have happened. Most of the methodical results of this study correspond to results of other surveys summarised by REUTHER et al. (2000). The percentage of 65.2% signs found under bridges is comparable to the results published by ROMANOWSKI et al. (1996) for Poland (56.9%) or by O'SULLIVAN (1993) for Ireland (62%). The proportion of the distances to be searched to find the first sign of an otter of 65.2% for the first 100m and 82.6% for the first 300m corresponds to the results summarised in REUTHER et al. (2000). As is shown in Table 5 the percentage of 65.2% for the first 100m is in the middle of the results published so far. However, the percentage of 82.6% for the first 300m is one of the lowest. There is no obvious explanation corresponding to the number of survey sites or to the percentage of positive sites of the different studies.
As already documented by REUTHER et al. (2000) very few reports give detailed numbers for the kind of proofs for the positive sites. Comparing these data with the results of the Ise River surveys it is obvious that the percentage of spraints was very low in the 1991 survey and increased remarkable in the 1999 survey. However, if the categories 'spraints' and 'spraints & footprints' are combined and sum up to 73.9% for the latter survey, this value is much lower than for most other surveys (Table 6). Following the hypothesis supported by JEFFERIES (1986), MASON and MACDONALD (1991) or GREEN and GREEN (1997) that the number of spraints or the number of spraints per survey site could be used as an indication for the population performance this low percentage could indicate a low population density. However, this hypothesis- is disputed (KRUUK et al., 1986; KRUUK and CONROY, 1987; CONROY and FRENCH, 1991).
This difference in the relationship of the kind of proofs could also result from the structures at the survey sites. As is shown in Figure 4 more than half of the proofs was found at survey sites which were classified as Very good' or 'good' because of their positive supply of potential places for finding signs of otters (sandbanks, flat muddy banks, stones, roots, etc.). These structural circumstances combined with the fact that the water level at the time of the survey was low at most of the survey sites might be a reason for the fact that the portion of footprints as signs for the occurrence of otters was much higher than in most other surveys. As is shown in Figure 3 the majority of the running waters in this study area has a width of 5m and less. This is also true for the portion of positive sites. Nevertheless the portion of positive sites at running waters of 6-10m width is nearly the double as for those of 0-5m width. In this study area no signs of otters were found at running waters of more than 10m width. The 'success rate' at running waters of 6-10m width (18.0% positive sites) was even more than the double as for those of 0-5m width (8.8%). This result does support the findings from Ireland, where "considerably fewer otter signs were found along small streams (<3m wide) than along larger watercourses" (O'SULLIVAN, 1993) or where "of the 124 negative sites located on running waters, all but 1 were situated on streams (<5m wide)" (CHAPMAN and CHAPMAN, 1982). At running waters of 0-5m width 64.3% of the signs of otters were found under bridges. At running waters of 6-10m width this percentage is 66.7%. This result seems to be in contrast to the findings of ROMANOWSKI et al. (1996) in Poland, where a more or less linear decrease of the percentage of otter signs found under bridges was obvious by the increase of river width. Though in this study on the widest running waters (>10m wide) no signs of otters were found as was the case in Poland at rivers wider than 60m. However, the number of survey sites and the number of positive sites in this study are much lower than in the Polish study and therefore might offer a lower precondition for a differentiation. Surprising is the fact that more than one third of the signs found away from bridges was found at survey sites which were classified as 'bad except bridge'. This means that, although the bridge seemed to be the only good place to find a sign of an otter, none was found there, but on the rest of the search stretch - which was classified as 'bad'. This indicates that a reduction of the survey sites to bridges exclusively increases the risk to miss signs of otters.
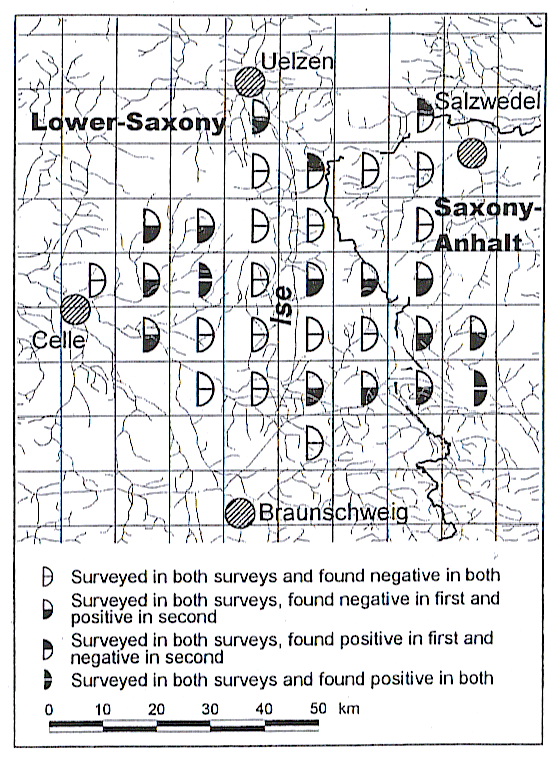
From the results it is obvious that there is an increase in the area inhabited by the otter. As is shown in Figure 5 in 1991 three of the four UTM squares occupied by the otter were located hi the eastern part of the study area at the border between the federal states of Lower-Saxony and Saxony-Anhalt. The fouth otter occurrence was located approximately 20km east of the city of Celle. Starting from these four more or less isolated points a re-connection and recovery tendency is obvious eight years later. The gap between the most northern and the most southern otter occurrence, representing a distance of nearly 50km, and the gap between the western and the eastern otter occurrence, representing a distance of more than 40km and characterised by a lower number of waters, was closed nearly completely. The results of these two surveys cannot answer the questions arising from these tendencies referring to aspects as:
It is hoped to get an answer to these questions by more continuous surveys in the future. ACKNOWLEDGEMENTS: We thank Anna Krekemeyer for processing the data by GIS and for preparing the maps. We also wish to thank Judith Eufinger for revising the English. This study is part of the scientific evaluation of the E+E project 'Revitalisation in the River Ise catchment - An ecosystem network focussing on the indicator species otter' and was financed by the Federal Agency for Nature Conservation (BfN) of the German Federal Ministry for the Environment, Nature Conservation and Nuclear Safety (BMU). REFERENCES Binner, U. 1991. Untersuchung Zur
Vemetzung der Fischotter-Population im Gebiet der Ise-Niederung Unpubl.
report to Aktion Fischotterschutz, 57 pp. Résumé : Quelques Résultats des
Prospections Loutre (Lutra lutra) Effectuées en 1991 et 1999 sur
le Bassin Versant de l'Ise en Basse-Saxe, Allemagne Resumen: Algunos Resultados de los
Relevamientos de Nutria (Lutra lutra) de 1991 y 1999 en el Río
Ise, Saxonia Inferior, Alemania |
|||||||||||||||||||||||||||||||||||||||||||||||||||||||||||||||||||||||||||||||||||||||||||||||||||||||||||||||||||||||||||||||||||||||||||||||||||||||||||||||||||||||||||||||||||||||||||||||||||||||||||||
| [Copyright © 2006 - 2050 IUCN/SSC OSG] | [Home] | [Contact Us] |