 |
Last Update:
Thursday November 22, 2018
|
| [Home] |
INTRODUCTION Like in many other European countries, the population of the Eurasian otter Lutra lutra L. decreased in Austria in the past decades. Although fully protected throughout the country since the early 1950s (Kraus, 1981), otter distribution in Austria has declined and reached a minimum with only one viable population in the Northern Waldviertel, Lower Austria. This area has a long-standing tradition in fish-farming. Since the early 1980s, fish-farmers have been complaining about increasing otter damage to their ponds (Bodner, 1994) due to an increase in the otter population in this area. This increase apparently was an inherant problem of the thriving fish-farming industry itself, as the number of artificially built ponds is increasing year by year. The otters would, so it was argued, benefit in particular from newly built, very small ponds, as they made foraging very easy. In consequence of the status of Lutra lutra L. as an endangered species, since 1984 Austrian fish-farmers have been compensated for their losses due to predation by the otter. These compensations are paid voluntarily by 4 different organisations (Department for Nature Conservation of the Government in Lower Austria, Hunting Authorities in Lower Austria, Organisation for the Conservation of Nature and the WWF Austria). More than 200 cases have been reported in the past eleven years. In this study the data of the damage cases are analysed. The analysis aims at investigating the diet of the otter in “damaged” fish-ponds, i.e. in ponds where otter eat an amount of fish high enough to be noticed by the fish-farmer. Conclusions from the data analysis are discussed with particular emphasis on the mutual influence of otter population and fish-farming industry on one another. MATERIAL AND METHODS Fish-Farming In The Waldviertel In the northern Waldviertel there are 1800 artificially built fish-ponds. Their size ranges from 15 m² to 60 ha, the total water surface area is 2000 ha. The main fish species farmed is carp (Cyprinus carpio L.) with more than 95% of the total fish biomass. Other important species are rainbow trout (Oncorhynchus mykiss Walbaum), tench (Tinca tinca L.), pike (Esox lucius L.), zander (Stizostedion lucioperca L.) and white fish (Coregonus lavaretus L.). The ponds are stocked, drained and restocked at regular turnover intervals (mostly 6 or 12 months). Documentation Of Damage Cases Fish loss was officially recognised as otter damage under the following conditions:
From the amount of missing fish at the time of pond drainage a certain percentage (according to data from literature) is substracted as natural loss. Equally substracted are shares for other predators such as heron or cormorant or for any other reason for fish mortality that is evident (e.g. very high water temperature in summer). For each damage case, the following parameters were known:
Analysis Of Data Between 1984 and 1994, 238 damage cases were recorded. For the present analysis, only the cases of the years 1991 till 1994 (207 cases) were taken, as the documentation had been rather unsystematic before that time. In addition to the parameters already mentioned, the following calculations were done:
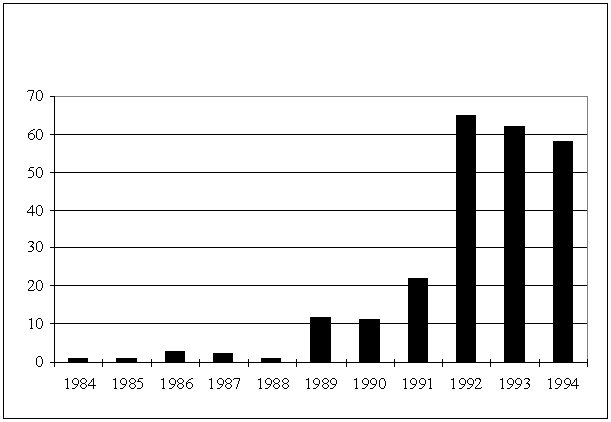
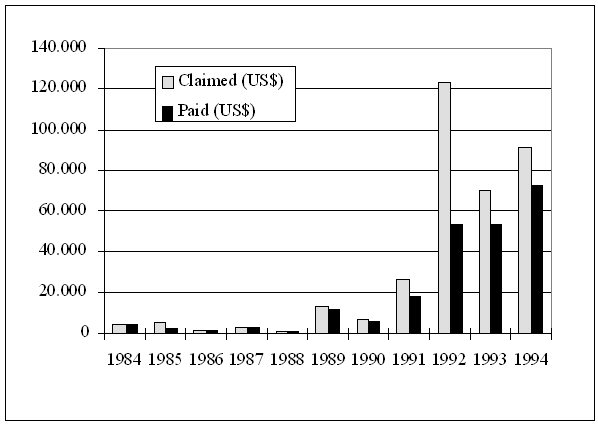
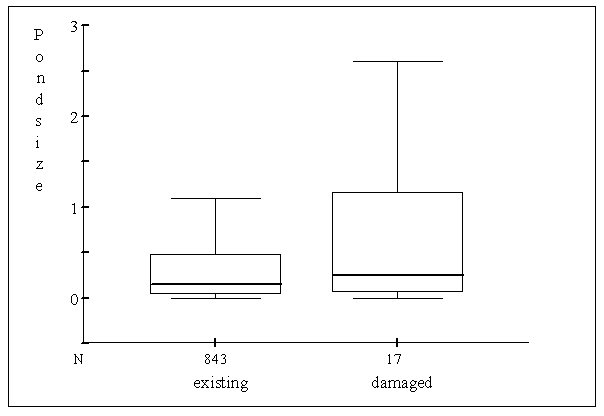
RESULTS Development of Damage Cases Both the number of damage cases and the total amount of compensations paid have been rapidly increasing from 1988 onwards (Fig. 1a and b). This development has reached its climax in 1992 (65 cases) and stayed on a constant level of about 60 damage cases per year since. Meanwhile, the amount of otter damage mounts up to an average of 500.000.- to 700.000.- ATS (50.000.- to 70.000.- US $) per year. Comparison of Pond Size The size of the ponds with otter damage was compared to the size of all ponds that exist in the area: contrary to the assumption that damage should occur in particular at small ponds, the analysis showed that “damaged ponds” are on average larger than “existing ponds” (Fig. 2).
Amount of Damage The amount of absolute damage (ATS) increases with:
No correlation was found between amount of damage and duration of turnover interval, number of fish species and number of fish age classes, respectively. The amount of relative damage (ATS/ha) increases with:
The difference between absolute and relative damage can only be understood knowing that the biomass of fish kept in the pond in the first place varies with pond size: whereas the absolute biomass (kg) of fish increases with increasing pond size, the relative fish biomass (kg/ha) decreases with pond size. These connections are important as a similar pattern can also be found in damage analysis (see above). Predation By The Otter
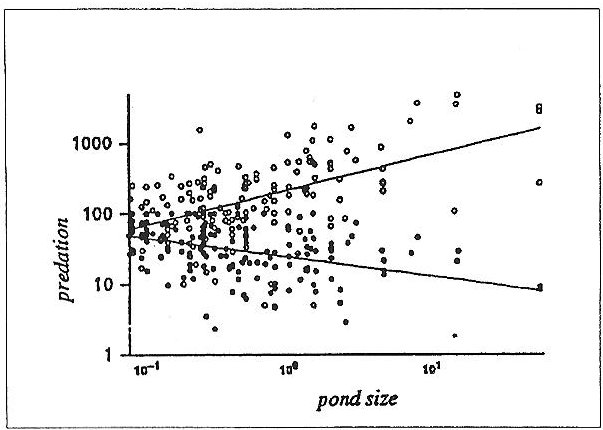
Equal to the damage, the predation of the otter varies with pond size: the absolute predation increases (SRC, r=0,6322, p<0,01, n=207) and the %predation decreases (SRC, r=-0,5183, p<0,01, n=207) with increasing pond size (Fig. 3). Predation On Different Fish Species
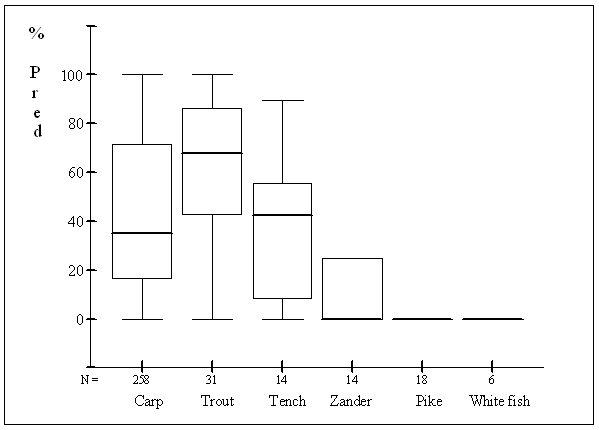
In order to compare predation on different fish species, the % - predation for this analysis was calculated as the ratio from absolute otter predation to expected absolute harvest, seperately for each fish age class in each pond. These values were compared for all six fish species (Fig. 4) and showed significant differences (H-Test of Kruskal and Wallis, a posteriori test of Tukey and Kramer, n=341, p<0,1): Carp differs from trout, zander, pike and white fish. Trout differs from all other species except tench. DISCUSSION AND CONCLUSIONS Whereas otter damage was low between 1984 and 1988, it has started to increase since 1989 and has more than trebled from 1991 to 1992. Then, local fish-farmers explained this development by an increase in the otter population of this area. Between 1992 and 1994, the otter damage stayed at a constant level. To begin with, no data were available on the distribution of the otter in the Waldviertel nor on the number of individuals this population contained. Meanwhile, Kranz (1995) confirmed an increase of the otter population in this fish-pond area. The same author also found that in some river systems, the otters has started spreading south. Both this and the fact that the otter damage to fish-ponds has remained constant for the last three years could mean that the region has reached its carrying capacity for otters and that the local otter population is no longer increasing. It has to be pointed out, however, that otter damage is defined via a procedure of negative exclusion: any fish loss that is not due to bad water quality, fish parasites or any other reason that can be thought of is defined as “otter damage” if otter presence at a certain pond is confirmed (see above). Thus, the mathematical calculation of this otter damage as it is done for compensation is exceedingly difficult and any results reached by this have to be interpreted with extreme care. The importance of small ponds as food source for the otter could not be confirmed. On the contrary, large ponds are over-represented in the damage cases. These results confirm a study by KRANZ (unpubl.) who found at only 42% of ponds smaller than 0,5 ha evidence for otter presence, wheras 100 % of ponds larger than 5 ha showed otter signs. Two reasons are suggested for this:
Clearly, for any potential damage the distribution of stocked fish is essential. The otter can only eat what is there in the first place, thus it is to be expected that patterns of fish distribution will be reflected in the damage as well. The amount of otter damage can be looked at in two ways:
The comparison of the percentage predation shows a similar pattern: percentage predation is higher in small ponds than in large ponds. This can be expained by the fact that otters clearly do not eat ratios but net amounts of fish biomass: any given amount of fish eaten by an otter will be represented with a higher percentage predation in a small pond with a small total amount of fish than in a large pond with a high total amount of fish. The comparison of predation on different fish species showed a high ratio of predation both for carp and for trout. In the case of the carp, however, it must be considered that the predation calculated from the fish loss not only contains fish eaten by the otter but also includes secondary damage (weight loss, parasites, etc.) if carp are disturbed by the otter while hibernating. Moreover, carp represent more than 95 % of the total fish biomass in the ponds. It is therefore, simply for statistical reasons, to be expected that otter predation on carp is high. Carp is taken by the otter as one prey species out of several, but otters in the Waldviertel have by no means specialised on this fish species. This result is also confirmed by Knollseisen (1995) who investigated the diet of the otter in the Waldviertel by spraint analysis. He found an annual average of 8,9 % for carp plus tench. The ratio of predation in the damage cases investigated is highest for trout, thus indicating the otter´s preference for this species in fish-ponds. Pike and white fish are taken least of all, it is unclear however if the otter actively avoids them or if these species are just more difficult to catch. Concluding the results of the study, the mutual influence of otter population and fish-farming industry can be summarised as follows: the existance of the otter population in the northern Waldviertel is no threat to the existence of the fish farming industry in the same area. Otters do, however, forage in fish ponds, a certain amount of fish loss (“damage”) being the result. The overall importance of small ponds for the otter population could not be confirmed. Although it seems to be a reasonable conclusion that fish are caught more easily in small ponds than in large ones this advantage remains hypothetic if the small ponds are not known to the otter, as seems to be the case. Small ponds represent a problem that is emotional rather than ecological as a net amount of fish loss in small ponds looks more dramatic than in large ones and is thus deplored more loudly by the fish-farmer. In large ponds, on the other hand, secondary damage to carp can lead to a high loss for the fish-farmer even if otter predation as such has been low. If big amounts of fish (up to several tons) are missing at the time of pond drainage, this is usually explained as secondary damage due to otter predation, providing other causes can be excluded (see above). This situation, however, gives rise to a number of questions. Further research on the biology of fish (in particular carp) in ponds in winter under the ice cover is needed to further reduce the probability of making mistakes when assessing otter damage. The fish-farming industry in general is of importance to the otter population as it increases the region´s carrying capacity for otters. Fish-ponds are for the otter one, but not the only one or the prefered source of food. In cold winter months when rivers are frozen and food availability generally is very low, ponds can be an essential food source for otters as they make it possible to overcome critical bottleneck situations. REFERENCES Bodner, M. (1994). Fischotter und Teichwirtschaft - vorläufige
Ergebnisse eines WWF Projekts. WWF Forschungsbericht Fischotter 2:
6-11. |
| [Copyright © 2006 - 2050 IUCN/SSC OSG] | [Home] | [Contact Us] |
